Cagayan de Oro has a high collection rate of 92% for municipal solid waste, yet 9% of the plastic waste generated remains unmanaged and significantly contributes to environmental pollution.
Context & Description
Cagayan de Oro is a highly urbanised city in the region of Northern Mindanao and the 10th most populous city in the Philippines. It is the capital of the province of Misamis Oriental where it is geographically located.
According to the 2015 census, the population of Metro Cagayan de Oro is estimated to be 1.37 million. Located along the north central coast of Mindanao island facing Macajalar Bay, the city is covering an area of 413 km² and has a tropical monsoon climate, with a wet and dry season. The survey was conducted during the dry season.
The motivation for undertaking the WFD was to understand and visualise the plastic leakage at different MSWM stages, in order to come up with solutions to further improve the performance of the MSWM system. This case study was implemented under leadership of the UN Habitat HOCCI programme.
Survey Implementation Arrangement
City
Cagayan de Oro
Financed by
UN Habitat - Healthy Oceans and Clean Cities Initiative (HOCCI)
Implemented by
Cagayan de Oro municipality with backstopping support from International consultants
Overview Data
Population
778,642 (2021 est.)
Waste generation rate, including commercial and institutional waste
0.38 kg/cap/day (WaCT Survey)
Total MSW generation
297 tonnes/day (WaCT Survey)
Collection rate
92% (WaCT Survey)
MSW sent to disposal
260 tonnes/day / 87% (WaCT Survey)
MSW sorted for recovery
16 tonnes/day / 5% (WaCT Survey)
MSW managed in controlled facilities
91% (WaCT Survey)
Plastic waste generation
15,203 tonnes/year
Unmanaged plastic
1,426 tonnes/year 9% of the entire plastic waste generation
MSW Composition at Point of Generation
WFD Results
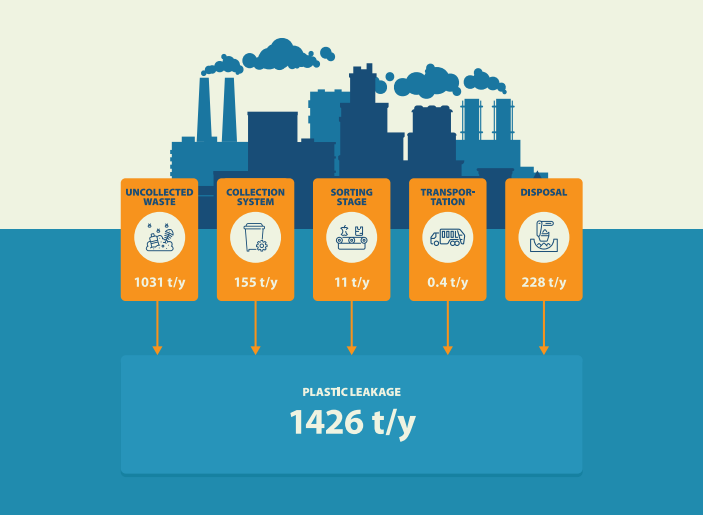
Plastic waste to the environment
1,426 tonnes/year
9% of the plastic waste generated
Plastic to water systems
214 tonnes/year
315 trucks
Plastic to water systems per person
0.3 kg/person/year
9 PET bottles per person
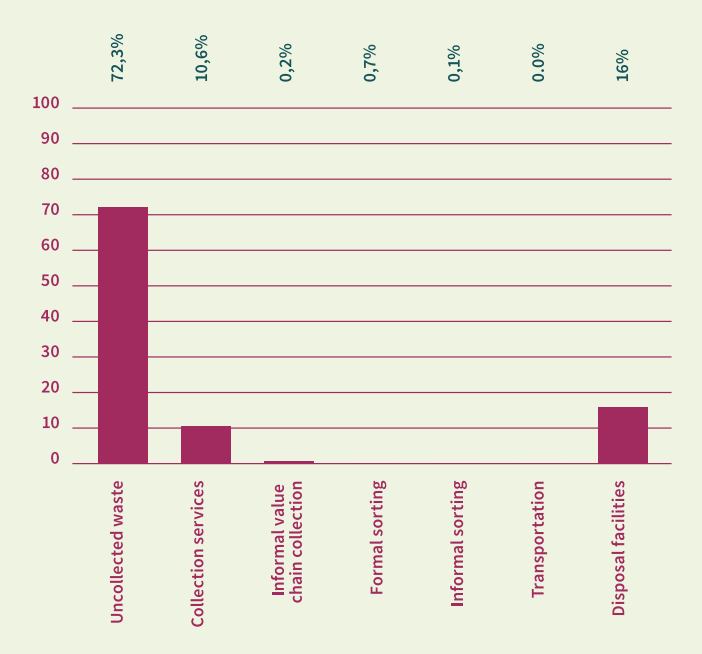
Contribution to Unmanaged Plastic Waste by SWM Stage
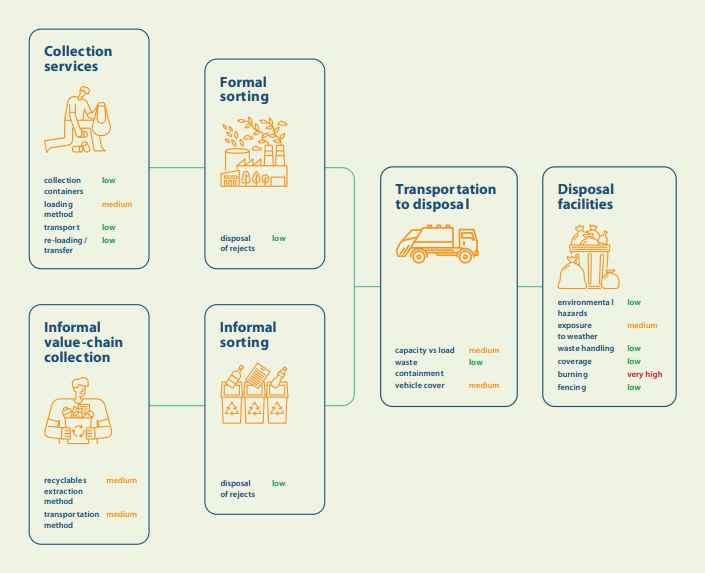
Plastic Leakage Potential Levels per Leakage Influencer
Lessons Learned & Challenges
The data published is collected in line with the WaCT concepts and definitions, which might not be aligned by similar concepts and requirements by laws and regulations in the Philippines when related to SWM;
The WFD assessment was carried out during the Covid-19 pandemic, in tandem with a WaCT assessment. Therefore, it was not possible for a consulting team to visit the city due to travel and cross-infection restrictions, however, the city committed to undertaking the full assignment on their own with remote guidance and backstopping support;
The city team was fantastic in their ability to mobilise the survey teams for the assessment and conducted a very thorough assessment;
The main lesson learnt was that a city/municipal team can do a WFD assessment, so long as they have backstopping support for understanding the methodology, approach and toolkit, and quality assuring the final output.
Use of WFD & Triggered Change
The WFD (and WaCT) assessment fed into a wider project managed by UN-Habitat, ‘Health Oceans and Clean Cities Initiative’, the focus of which was on reducing marine plastic pollution;
The WFD assessment provided an authoritative baseline upon which to design follow-up ‘Action Planning’ initiatives, with the City decision makers taking a lead role in formulating and adopting pollution prevention measures.