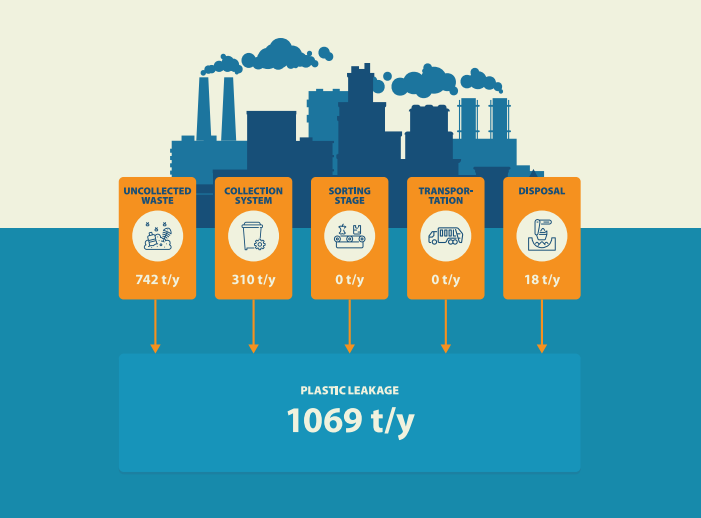
Significant waste leakage occurs at community bin locations and during the transfer between primary and secondary collection points, with open littering also being a major issue.
Context & Description
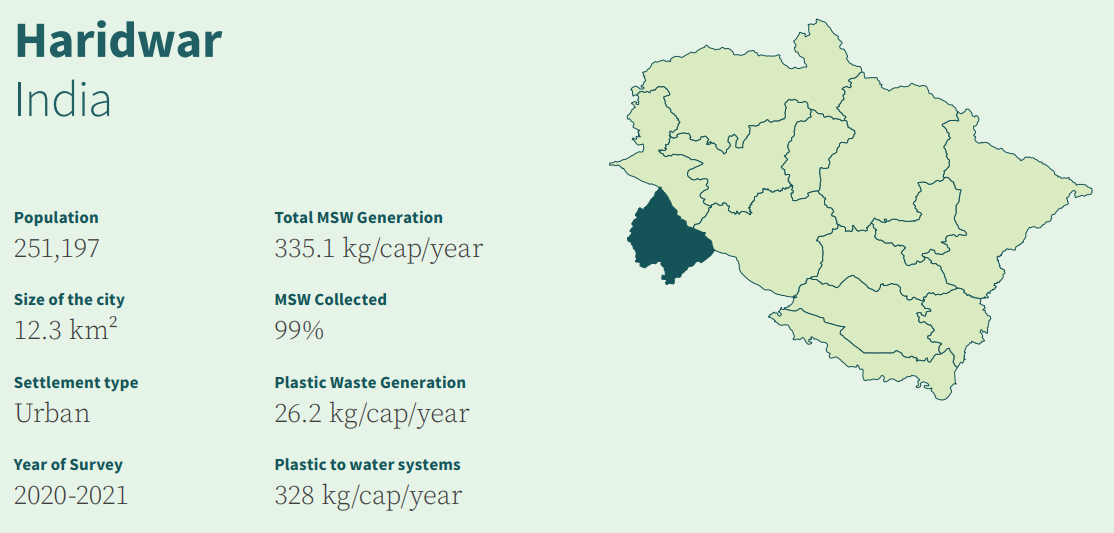
Haridwar is a city and municipal corporation in the Haridwar district of Uttarakhand. The city, which is situated on the western bank of the river Ganges, has a significant national cultural importance and serves as a gateway to several places of worship.
One of the most significant events is the Kumbh Mela, during which millions of pilgrims, devotees, and tourists congregate in Haridwar to perform ritualistic bathing on the banks of the river Ganges.
Haridwar Municipal Corporation, Haridwar Nagar Nigam (HNN), consists of 60 wards with a total population of 251,197 in 2018, which makes Haridwar the second largest city in the state of Uttarakhand and the largest in the district.
The assessment of Haridwar was conducted from November to December 2020 during the ongoing COVID-19 pandemic in India. In order to prevent infection risks for the personnel of this assessment and due to existing restrictions, this study had to be conducted with certain limitations and adjustments of the methodology. Due to the COVID-19 pandemic, deviations from the previous disposal behaviour were observed, with a tendency to an increased share of sanitisation and hygiene products, packaging waste as well as delivery and to-go food and beverage containers.
Survey Implementation Arrangement
City
Haridwar
Financed by
GIZ
Implemented by
GIZ
Overview Data
Population
251,197
Waste generation rate, including commercial and institutional waste
Contribution to Unmanaged Plastic Waste by SWM Stage
Plastic Leakage Potential Levels per Leakage Influencer
Lessons Learned & Challenges
Overall, volumes and capacities of primary waste collection vehicles and bins were found to be generally sufficient for the city’s requirements. However, waste leakage at community bin locations, at transfer points between primary and secondary collection, as well as open littering are major challenges within the MSWM system;
In order to increase waste recovery, waste segregation, separate collection and transportation streams need to be introduced.
Use of WFD & Triggered Change
Ground quantification of waste leakage in Haridwar requires significant resources and financial efforts, the application of the WFD provides an easy and low-cost way to estimate waste leakage and track progress of infrastructure interventions.