Huế city has a high collection rate of 97% for municipal solid waste, with a significant focus on improving its waste management system through the "Huế City – A Plastic Smart City in Central Vietnam" project, utilizing the Waste Flow Diagram (WFD) to guide improvements.
Context & Description
Huế city is located in central Viet Nam with the Perfume River running through it and leading to the East Sea.
The population was estimated to be 488,157 people in 2020, prior to the 2021 administrative boundary extension with the Extended city area now encompassing 266km². The WFD was carried out for both the Core and Extended areas which included collecting samples from 9 wards and communes including 6 in the Core area and 3 in the Extended area of the city.
The extension of the city resulted in an urgent need to assess its MSWM system and reduce plastic waste. This included undertaking the WFD in order to build a database and implement the project “Huế city – A Plastic Smart City in Central Viet Nam” which aims to improve their MSWM system.
Survey Implementation Arrangement
City
Huế
Financed by
WWF - TV Action-Plastic Smart Cities
Implemented by
National consultants with backstopping support from International consultants
Overview Data
Population
488,157 (2020)
Waste generation rate, including commercial and institutional waste
0.83 kg/cap/day (WaCT Survey)
Total MSW generation
408 tonnes/day (WaCT Survey)
Collection rate
97% (WaCT Survey)
MSW sent to disposal
313 tonnes/day / 77% (WaCT Survey)
MSW sorted for recovery
83 tonnes/day / 8% (WaCT Survey)
MSW managed in controlled facilities
77% (WaCT Survey)
Plastic waste generation Core / Extended Area
19,337 tonnes/year 3,516 tonnes/year
Unmanaged plastic waste Core Area
349 tonnes/year 1.8% of the entire plastic waste generation
Unmanaged plastic waste Extended Area
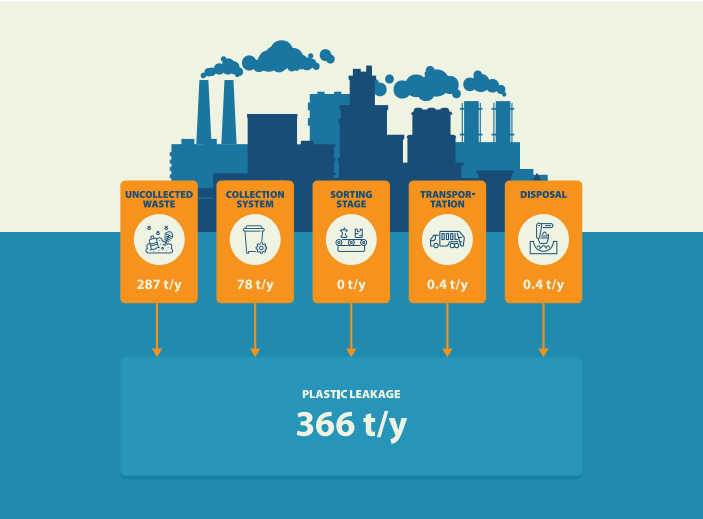
366 tonnes/year 10.4% of the entire plastic waste generation
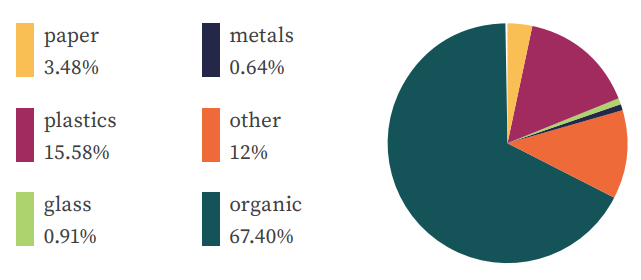
MSW Composition at Point of Generation Core Area
MSW Composition at Point of Generation Extended Area
WFD Results Core Area
Plastic waste to the environment
350 tonnes/year
2% of the plastic waste generated
Plastic to water systems
219 tonnes/year
322 trucks
Plastic to water systems per person
0.6 kg/person/year
21 PET bottles per person
Contribution to Unmanaged Plastic Waste by SWM Stage Core Area
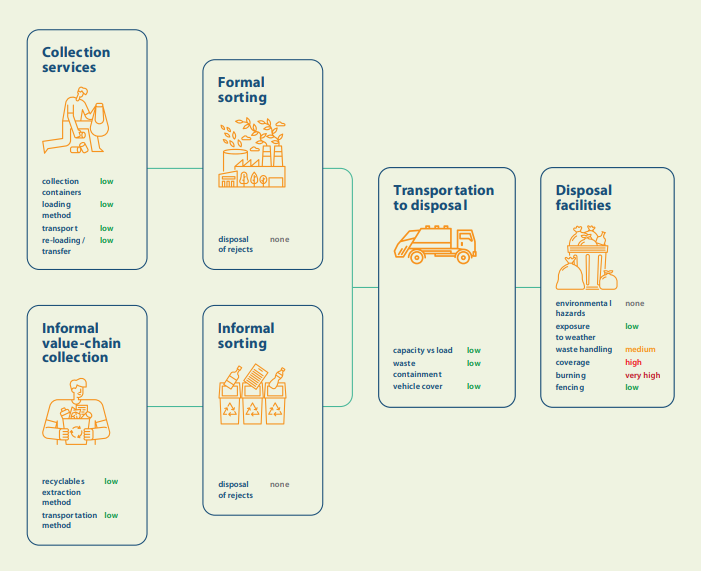
Plastic Leakage Potential Levels per Leakage Influencer in the Core Area
WFD Results Extended Area
Plastic waste to the environment
366 tonnes/year
10% of the plastic waste generated
Plastic to water systems
273 tonnes/year
402 trucks
Plastic to water systems per person
2.0 kg/person/year
68 PET bottles per person
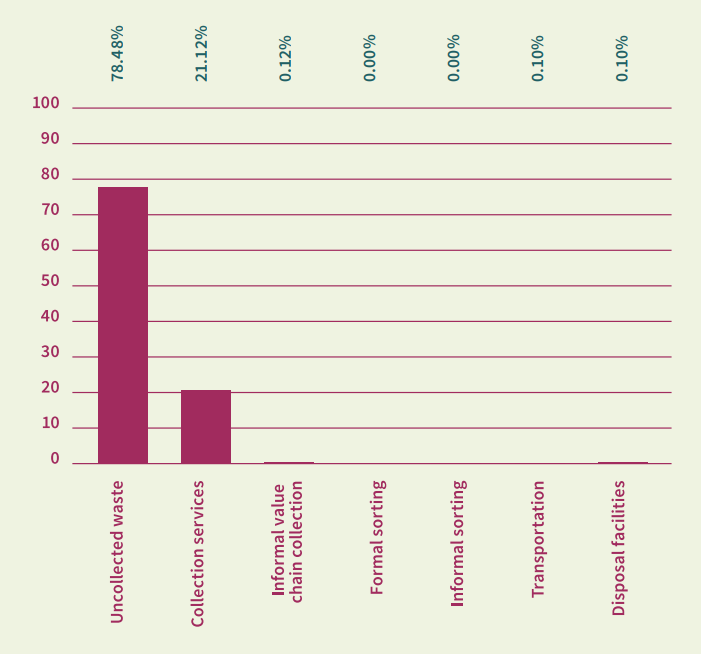
Contribution to Unmanaged Plastic Waste by SWM Stage Extended Area
Plastic Leakage Potential Levels per Leakage Influencer in the Extended Area
Lessons Learned & Challenges
Initially, the timescale of the assessment was longer than estimated, which was mainly due to COVID and a lack of data. Therefore, the assessment was performed by taking into consideration two approaches: Huế City Core Area and Huế City Extended Areas. Additionally, SWM data for the extended area was not always readily available;
It was difficult to arrange interviews with and survey informal recovery facilities and waste pickers. This was due to the complicated trading relationship between recovery facilities;
There was some concern that the WFD might structurally overestimate leakages to water, this was when compared to a plastic waste hotspots study;
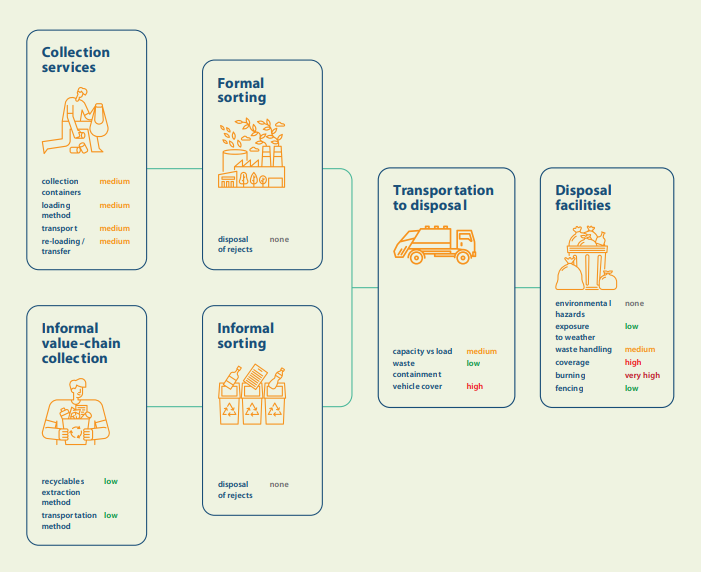
The WFD differentiates between informal service chain, informal value chain, formal sorting, informal sorting, collection rate, collection service coverage rate etc. All of these categories require careful attention when inputting data.
Use of WFD & Triggered Change
Informal collection and recovery are currently not considered under collection efficiency, resulting in some complications when showing and highlighting materials extracted from landfill, whilst not losing these from collected waste;
The Sankey diagram does not allow for differentiation between materials recovered from landfill either by waste pickers or formal recovery systems. Instead, it was redesigned to show diversion from landfill by informal recovery.