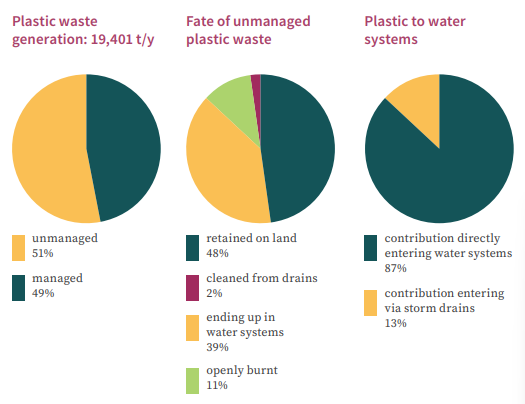
Over half of the plastic waste generated in Mombasa ends up in water systems either directly or through storm drains.
Context & Description
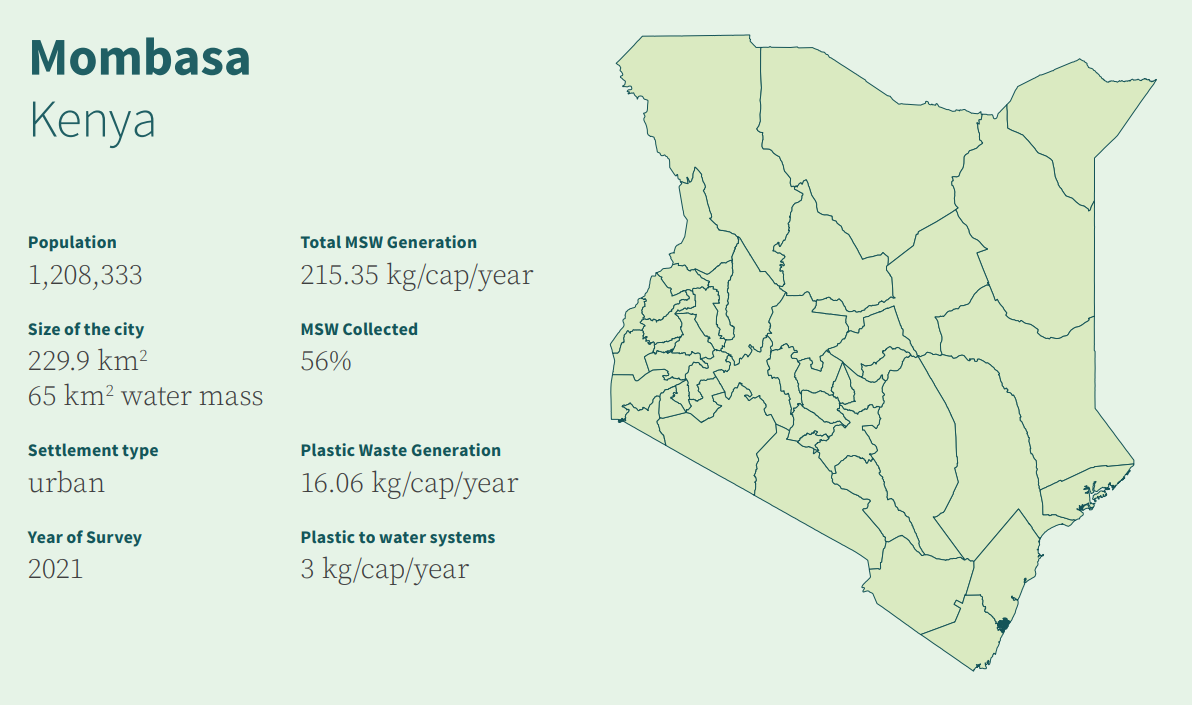
Mombasa is the second largest city in Kenya and located on the shore of the Indian Ocean, a cosmopolitan city with an estimated resident population of 1.2 million persons, translating to a density of 4,097 persons per square Kilometre.
There are 6 sub-counties and 29 wards within Mombasa County with varying means of MSW collection within the wards. There are county collection trucks, mainly collecting from common collection points, private companies and registered individuals/groups using handcarts, collecting from households (HH) and premises. Mombasa County generates approximately 708 t/day of MSW and out of this, 56% (396 t/day) is collected. Out of 396 t/day of waste collected in Mombasa, 5% (36 t/day) is managed in controlled facilities through processing for recovery. There are numerous companies dealing with recovery of various types of materials including paper & cardboard, plastic (HDPE, LDPE, PP and PET), metals and glass with paper & cardboard having the highest demand and biggest fraction recovered, up to 20t/day. There is one main designated waste disposal site in Mombasa, Mwakirunge. It is located approximately 30 kilometres from the city centre and sits on 50 acres of land that is owned by the county government. The city also has 4 other ‘recognised’ disposal sites; 50% (355 t/day) of the MSW generated is managed through disposal sites. All the dumpsites in Mombasa have no environmental control.
Survey Implementation Arrangement
City
Mombasa
Financed by
UN Habitat
Implemented by
International and National consultant
Overview Data
Population
1,208,333 (2020)
Waste generation rate, including commercial and institutional waste
0.59 kg/cap/day (WaCT Survey)
Total MSW generation
708 tonnes/day (WaCT Survey)
Collection rate
56%
MSW sent to disposal
355 tonnes/day / 50% (WaCT Survey)
MSW sorted for recovery
40.5 tonnes/day / 6% (WaCT Survey)
MSW managed in controlled facilities
4% (WaCT Survey)
Plastic waste generation
19,401 tonnes/year
Unmanaged plastic
9,961 tonnes/year 51% of the entire plastic waste generation
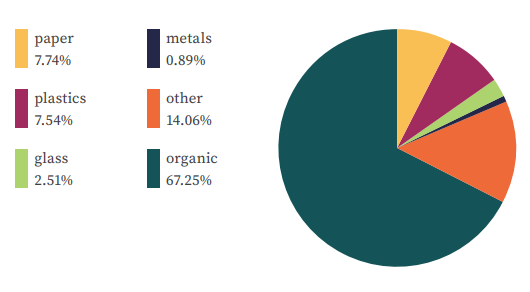
MSW Composition at Point of Generation
WFD Results
Plastic waste to the environment
9,961 tonnes/year
51% of the plastic waste generated
Plastic to water systems
3,885 tonnes/year
5,287 trucks
Plastic to water systems per person
3 kg/person/year
99 PET bottles per person
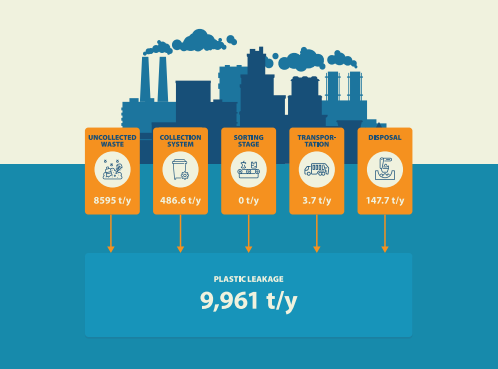
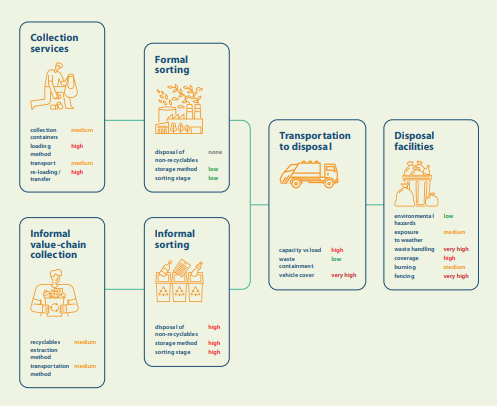
Contribution to Unmanaged Plastic Waste by SWM Stage
Plastic Leakage Potential Levels per Leakage Influencer
Lessons Learned & Challenges
Very small changes in the WFD baseline data entry interface results in significant differences in the results. For example, should there be a minor error in calculating composition analysis, even by 1%, the amount of plastic to water per person increases or decreases significantly
The tool requires skilled predictions when assigning formal and informal sorting for recovery. Therefore, this requires an expert to conduct this assessment, as training others with limited experience may not result in accurate outcomes.
Use of WFD & Triggered Change
The WFD results have been utilised at multiple international events to promote recognition of the importance of tacking plastic pollution emissions in coastal cities in low and middle income countries
The WFD outcomes informed the development of investment projects in partnership with international development organisations.