Municipal and plastic waste generation varies considerably depending on many factors, but most prominent amongst them is income and socio-economic context. As can be seen in the figure below, MSW generation rates across the profiled cities vary from between 0.29 kg/cap/day in City, Nepal, to 2.57 kg/cap/day in Tulum, Mexico. Most waste generation rates profiled are less than 1.0 kg/cap/day, with an average of 0.71 kg/cap/day and a median of 0.63 kg/cap/day.
The high MSW generation rate found for Tulum is likely due to the city being a highly touristic location with around 2 million people visiting annually. It is well established that the additional number of people within a city due to tourism, as well as the different activities and types of waste these tourists produce, can lead to significant increases in waste generation (Diaz-Farina et al., 2020; Martins and Cró, 2021). This is supported by the fact that the two other case studies with MSW generation rates above 1.5 kg/cap/day are those of Ulcinj, Montenegro, and Sihanoukville, Cambodia, both of which are characterised by a large number of tourists in comparison to their residential population.
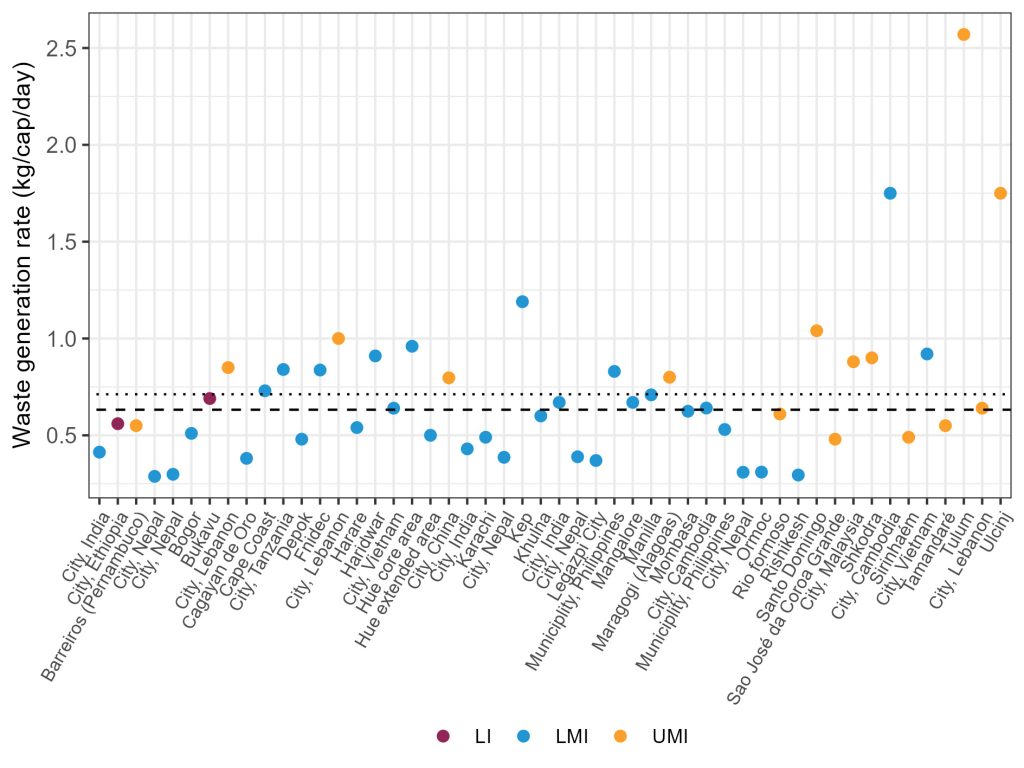
Figure
Comparison of MSW Generation Rate
The proportion of plastics in the MSW stream varies considerably, depending on the consumption habits and activities in the city. Plastics are believed to make up around 12% of MSW generation globally, with this number not varying drastically in all but the lowest income group (Kaza et al., 2018).
However, measuring plastic waste generation in low- and middle-income countries has traditionally been challenging due to the prominence of the informal waste management, service and value chain. For example, sampling waste composition at the point of disposal can lead to an underestimate of plastic waste generation due to the informal sector having already removed valuable plastic items prior to the sampling location.
This difficulty is largely avoided in the WFD due to a system-wide approach being taken that incorporates waste flows from across the MSWM system, including any activities of the informal sector. Likewise, the WaCT, which is the recommended approach for SWM data collection in the WFD, similarly accounts for the informal sector’s activities.
The amount of plastic as a proportion of total MSW generation can be seen in the figure below. It was found that the amount of plastic is slightly higher than the average outlined by Kaza et al. (2018) as on average 15% of MSW is composed of different types of plastic materials. The range of plastic generation varies from as low as 6% in City, Tanzania; Ulcinj, Montenegro; Bukavu, Democratic Republic of the Congo; and Khulna, Bangladesh, and up to 32% in Sihanoukville, Cambodia. Although City, Ethiopia is a LI country, it was found that its plastic generation was also comparable to many other LMI and UMI cities, with a value of 12%.
Figure
Comparison of Plastic Waste Generation
Uncollected waste is the biggest contributor to plastic pollution worldwide (Lau et al., 2020). It is estimated that around 2 billion people globally do not have regular and reliable waste collection services, meaning that they are forced to self-manage their waste. This includes openly burning their waste, or dumping it into rivers, storm drains, or the wider environment. As such, the collection coverage is a key indicator of the likely amount of plastic pollution which is also confirmed by the WFD applications.
The figure below breaks down the MSW collection data for each case study. These are that the waste remains uncollected (and is therefore dumped or openly burnt), is collected by service providers, or is collected by the informal value chain (i.e. waste pickers).
For the majority of case studies, collection by service providers is the dominant management method, accounting for 79% of MSW generation on average. In contrast, uncollected waste accounts for 15% on average and informal value-chain collection for 6% on average.
Large variation is seen however between the case studies as would be expected. The city with the highest collection by service providers is City, China achieving 100%, whilst seven other case studies achieve 95% or more. On the other hand, the city with the largest proportion of waste collection by the informal recycling sector is that of Huế (Viet Nam) accounting for 21% of MSW generated. Data included the amount of food waste collected by pig farms and re-used for animal feeds.
Uncollected waste is a critical issue in determining the amount of plastic pollution. Four of the case studies have over 50% of their generated MSW remaining uncollected. These are Bukavu (91%), Ormoc (63%), Harare (60%), and Mombasa (50%). Surprisingly, only one of these cities is within a LI country (Bukavu), with the others being LMI countries. This suggests that collection service coverage is not solely related to income level, but also may depend on other factors.
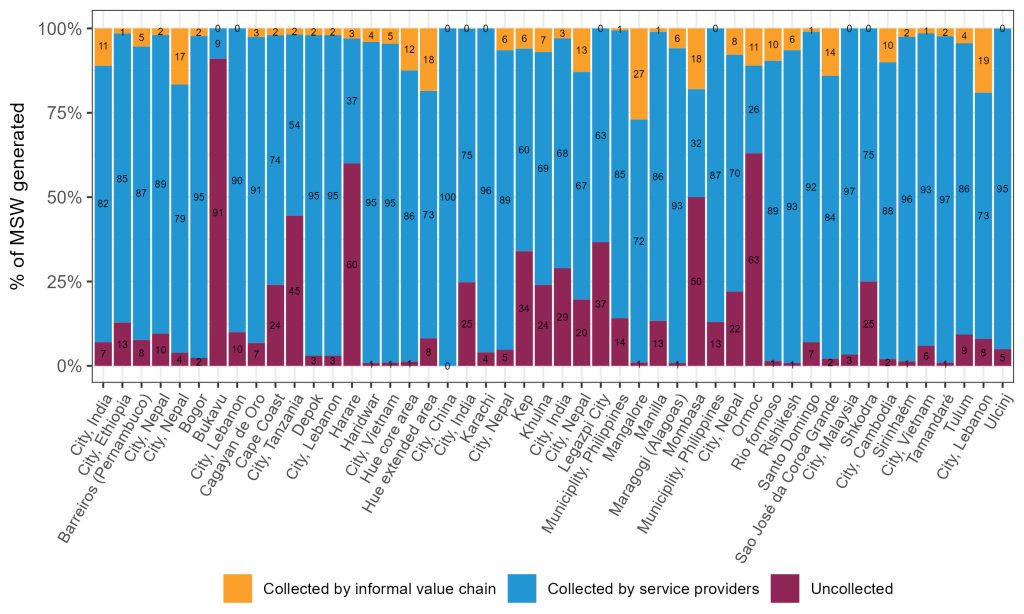
Figure
Comparison of Waste Collection Practices
SDG 11.6.1 is defined as the proportion of MSW collected and managed in controlled facilities out of total municipal waste generated. This is calculated via the WaCT and links to the WFD accordingly. The results of SDG 11.6.1 for the profiled case studies can be seen in the figure below.
Five of the WFD profiled cities achieve over 95% of their waste being collected and managed in controlled facilities. These are Tamandaré, Brazil (96%), Sirinhaém, Brazil (94%), City, China (97%), Seremban, Malaysia (97%) and Municipality, Lebanon (95%). On the other hand, 20 out of the 50 cities (40%) had less than 5% of the MSW being collected and managed in controlled facilities. This is due to the cities having incomplete collection coverage and/or a high incidence of uncontrolled disposal.
The average level of controlled management is 56% whereas the median was 46% across the case study cities. These statistics do not adequately reflect the largely bimodal distribution of results, in that the results tend to be either close to zero or approaching 100. In fact, 78% of results were either above 80% or below 10%.
Intuitively this bimodality makes sense as cities, when establishing their waste management system, usually first prioritise waste collection and then controlled disposal only after this. As such, a city which has achieved widespread collection and decides to then invest in controlled disposal will typically have controlled management approaching 100%. On the other hand, a city that is still struggling with collection service coverage is unlikely to have invested in (or sustained) controlled disposal, therefore according to the WaCT methodology the level of control remains close to zero.
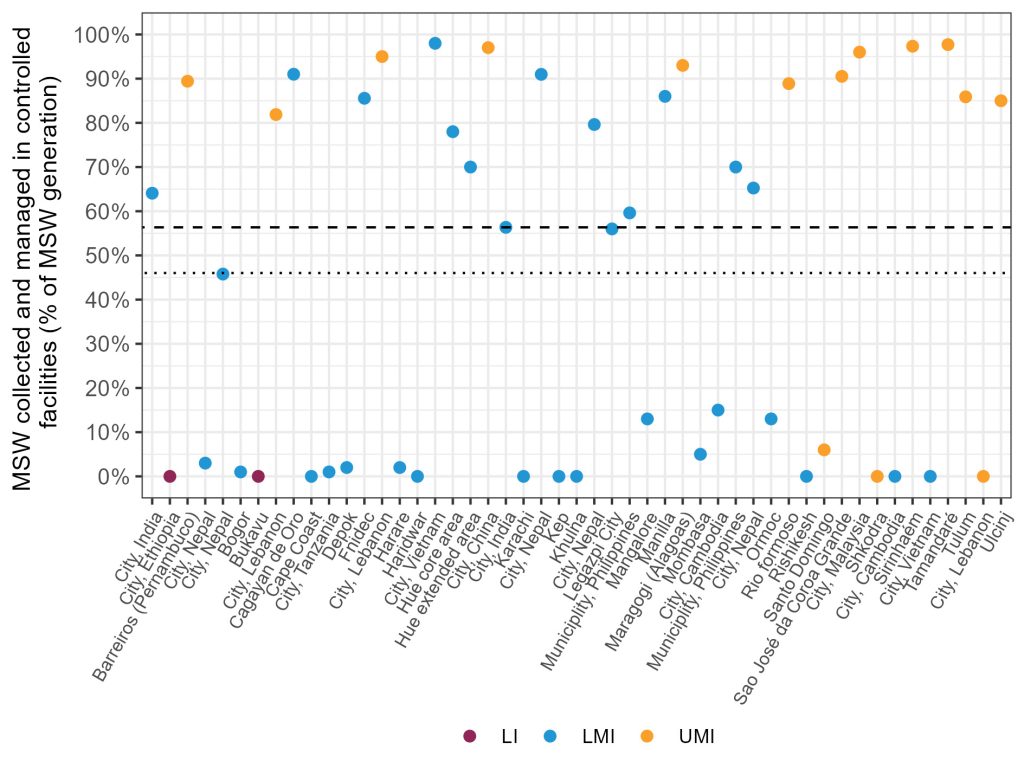
Figure
Comparison of MSW Collected and Managed in Controlled Facilities
Figure 1 shows the amount of unmanaged plastic waste (total plastic leakage into the environment including openly burnt plastic) by case study. This largely correlates with the proportion of uncollected waste found (see above: MSW Collected). This is because all uncollected waste is assumed to be released into the environment or openly burnt, therefore directly contributing to the amount of unmanaged plastic waste.
There is a strong relationship between plastic pollution and uncollected waste, as uncollected waste is typically the largest single source of plastic pollution in cities with low-medium collection service coverage (which is most of these profiled case studies).
On average 24% of all plastic waste generated becomes unmanaged plastic waste in the environment across the case studies profiled. It should be noted that unmanaged waste within the WFD is defined as the summation of both uncollected waste and waste that leaks out from the solid waste management system, whether intentionally or not, as well as illegally dumped waste in the environment.
This differs from the widely used mismanaged waste definition in that it excludes waste that is collected but disposed of in uncontrolled disposal sites. Instead unmanaged plastic waste focuses on the plastic waste that is more dispersed in the environment and much more likely of becoming mobile and therefore potentially becoming marine litter.
The city with the highest proportion of unmanaged waste is Bukavu, whereby 94% of plastic waste generated is believed to become unmanaged in the environment. This very high value is due to its low collection coverage of just 7%, meaning 93% of waste remains uncollected and subsequently burnt or dumped into the environment. In contrast, City, China has the lowest proportion of unmanaged plastic waste with only 0.4% of generated plastic waste estimated as leaking into the environment due to its complete collection coverage, and well-functioning MSWM system.
The amount of unmanaged plastic waste in a city can also be shown via a different metric; the amount of unmanaged plastic waste in kilograms per capita per year. This has the advantageover the previously shown metric of unmanaged plastic waste (i.e. when expressed as a proportion of plastic waste generation) in that it also accounts for the overall amount of plastic waste being generated.
For example, a city with a high amount of plastic waste being generated compared to other cities, but only a small proportion of this being unmanaged, would rank worse on a kilogram per capita basis to reflect that there is still a large absolute amount entering the environment. In contrast, a city with a large proportion of unmanaged plastic waste as a proportion of generation but with very little actual generation, would rank better on a per capita basis, as a lower overall quantity is being released into the environment. Additionally, as the metric uses mass as a basis, the amount emitted is easier to conceptualise, particularly when converted to the number of items it represents, or as shown visually in Figure 10c. These metrics are crucial to allow comparison of how well a city performs on plastic pollution prevention compared to other cities.
A grouping or indicator-based approach has also proven effective in communicating performance levels. Such an approach can be used to present the outcomes of a WFD assessment in ‘emission bands’ in terms of kilograms per person per year of plastic emissions.
The orange area in Figure 2a shows the density of underlying data (i.e. where most data lays). The underlying data points are shown by the light grey dots, whilst five emission bands A-E are shown by the coloured bands in Figure 2b.
Emission bands are provisionally set on the basis of the 50 case studies and will be updated later when a broader spread of WFDs are available.
The Quality Assurance Matrix shows how the plastic pollution emission bands apply to the 50 case studies profiled here. The results on a kilogram per capita per year basis differ considerably when compared as a percentage of plastic waste generation. For example, touristic locations such as Tulum and Sihanoukville fall into Band E despite their relatively well-functioning waste management systems due to them having high plastic waste generation and low population. Small absolute emissions therefore count for a lot on a per capita basis.
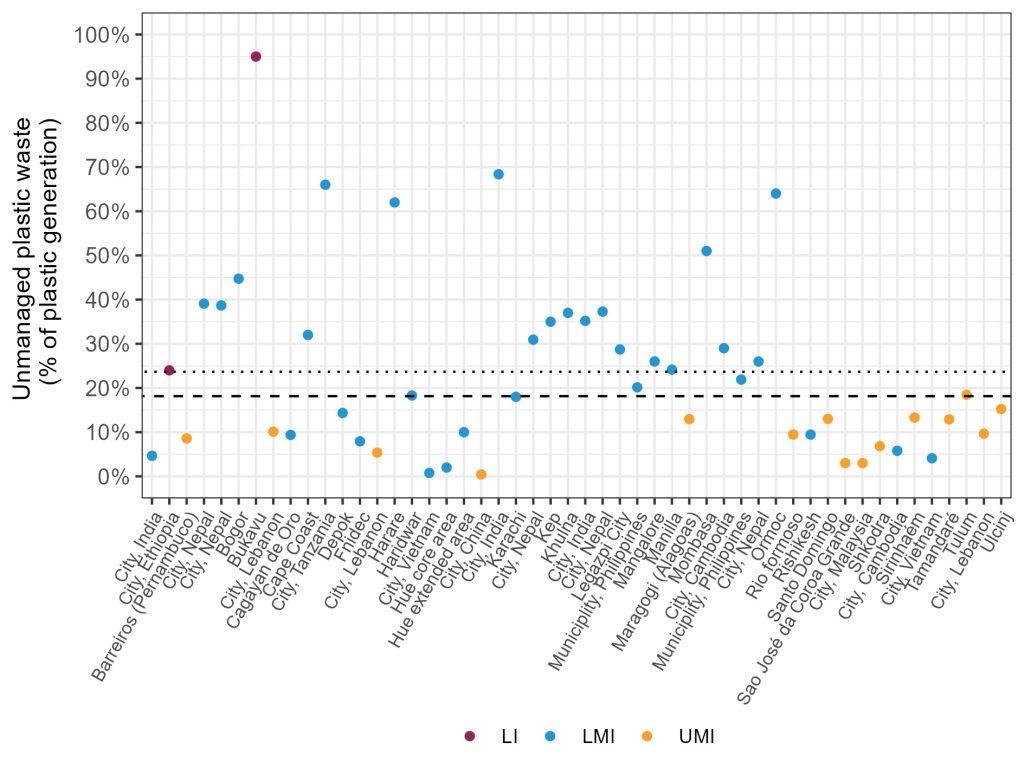
Figure 1
Comparison of Unmanaged Plastic Waste


Figure 2
a) Violin Plot of Unmanaged Plastic Waste and Plastic Pollution Emission Bands
including Number of Case Studies in each,
b) Visual Representation of 1kg Plastic Waste,
c) Case Studies According to the Emission Bands
* These cities have a high number of tourists in comparison to their residential population. As such, they tend to produce higher amounts waste than other cities. Even though many of themhave relatively well functioning solid waste management systems, with only a few percentage points leaking, they are still found to fall into the higher emission bands. This is due to a combination of their higher overall waste generation, and the fact that the per capita rate calculated here only includes residential population.
It is crucial to understand the sources where plastic leakages originate in order to prevent plastic pollution. The WFD toolkit allows this assessment across seven different potential sources. The contribution of each of these sources as a proportion of the total amount of plastic that becomes unmanaged in a location is seen in the figure below.
Across all case studies, leakage due to uncollected waste, leakage from collection services and leakage from disposal sites typical rank highest in terms of their contribution to unmanaged plastic waste.
This leakage is a symptom of deficiencies within the MSWM system with the amount of leakage dependent on where plastic is in the system, highlighting that there is poor management in the areas where values are highest.
The contribution from uncollected waste is not surprising. Likewise, leakage from collection services is also unsurprisingly high due to inter-linkages between the waste storage and collection services across often large and diverse cities. On the other hand, the fact that leakage from disposal sites is comparably high in many case studies is perhaps more surprising.
Typically, it would be expected that as waste is aggregated from collection through to disposal, the chance of it escaping into the environment reduces due to much of the waste becoming surrounded by other waste and therefore not so easily exposed to the elements. Perhaps one of the main reasons for the relatively high incidence of leakage from disposal sites is that they are often located in low-lying, flood prone land, or within or adjacent to streams and rivers.
Leakage from sorting activities, transportation and informal value-chain collection typically account for only small contribution to unmanaged waste, therefore are unlikely to be key intervention points for reducing plastic pollution.
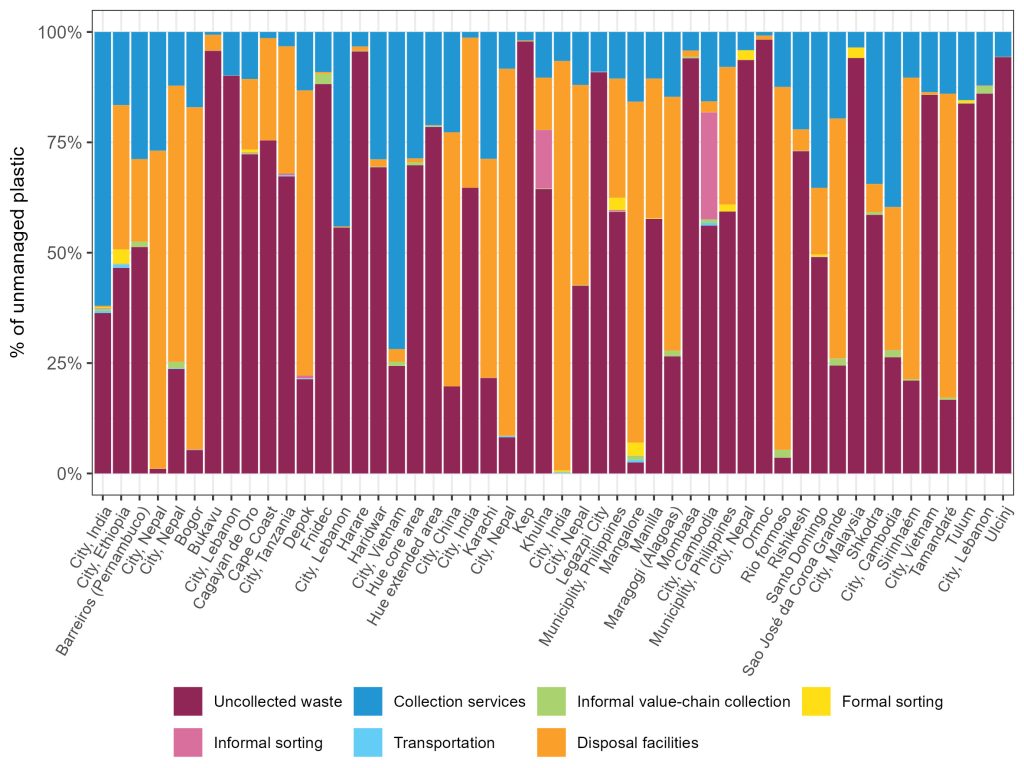
Figure
Comparison of Unmanaged Plastic Waste Sources
Unmanaged plastic waste in the environment may end up in different locations, termed in the WFD as ‘fates’. For example, uncollected plastic waste may be openly burnt by residents as a form of disposal, or dumped directly onto land, into storm drains, or into waterways. Any plastic on land may also subsequently become mobile and transfer to waterways or storm drains. Likewise, plastic waste in storm drains may be flushed to rivers during periods of heavy rain or periodically removed by city cleaners.
Within the WFD, observational based methods are used to allocate the fates of unmanaged plastic waste. For example, the amount of uncollected waste that is openly burnt is dependent on how much evidence there is for open burning in areas that lack waste collection services. In certain cases, such as the movement of diffuse plastic waste to water, it is difficult to see any evidence of plastic transfer to water simply due to the water carrying the plastic away. In these situations, proxies are used as an estimate of plastic waste transfer to water related to the distance of waterways and whether there are any barriers, (e.g. vegetation) likely to stop this transfer.
The proportion of unmanaged plastic waste by fate for each case study is shown in the figure below. The majority of unmanaged waste enters water or is retained on land. Taking averages across the case studies shows the water fate accounts for 40% of unmanaged plastic waste, on average, whereas retained on land accounts for 49%, on average. Alternatively, 8% of unmanaged plastic waste, on average, is openly burnt, whereas cleaning from storm drains is 3%.
The estimated amounts of openly burnt waste is surprisingly low given that much of the unmanaged plastic waste is believed to have come from uncollected waste (see above: Plastic Leakage Sources) and that this is typically associated with high levels of open burning (Wiedinmyer et al., 2014). It is possible that the observational-based assessments used in the WFD struggle to find clear evidence of open burning. This may be due to burn sites occurring on private land (e.g. in peoples gardens), or the same site being used for multiple burnings, therefore giving little indication of the frequency of burning.
Caution is advised in drawing conclusions from these averages as significant variation in the actual values is seen across case studies. For example, Tulum has the lowest amounts of unmanaged plastic entering water as a proportion of all unmanaged plastic at just 5%, whereas Huế (expanded area) has the largest percentage at 75%. Likewise, in Hue (expanded area), Municipalities in Lebanon and City, Nepal; no evidence of open burning was found despite some of these having relatively high amounts of uncollected waste. Whereas for comparison, the majority of Kep’s unmanaged waste was openly burnt at 45%.
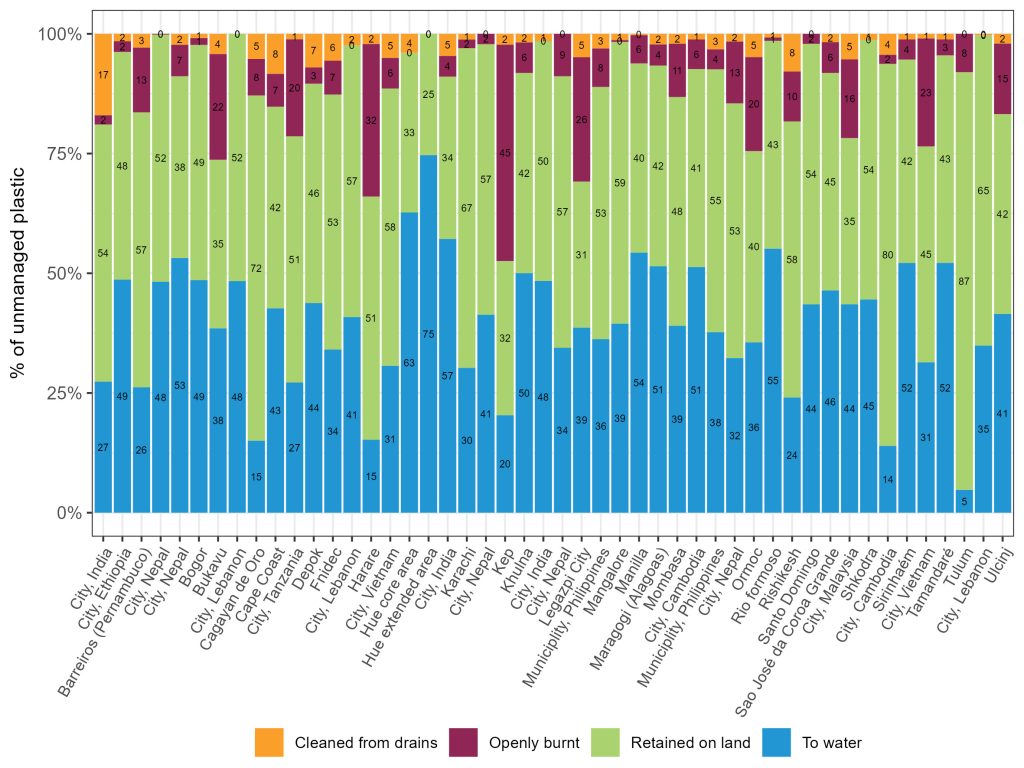
Figure
Comparison of Unmanaged Plastic Fates